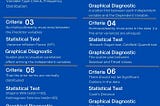
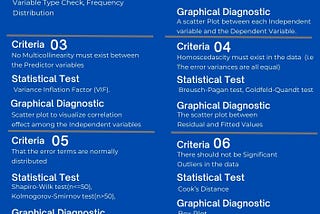
Ayobami AkiodeinDataDrivenInvestor7 criteria that must be met before using a linear regression model (LRM) for predictionIn this article, we would look at the seven criteria that must be met before using Multiple Linear Regression to model a prediction. So…Mar 31, 2023Mar 31, 2023
Ayobami AkiodeinDataDrivenInvestor23 practical and useful tips to creating compelling data visualizationData is a tool; how you use it, is the artSep 6, 2021Sep 6, 2021
Ayobami AkiodeinAnalytics VidhyaUsing Visualization Algorithms (VAT & iVAT) To Assess Cluster TendencyBe ‘Visibly' sure there are clusters in that dataset before profiling what the main themes are.May 17, 2021May 17, 2021
Ayobami AkiodeinGeek CultureVisualization Only! Not Enough. How to Carry Out Bivariate Statistical Test in PythonTest the predictor feature statistically at bivariate, before including it in the modelMar 18, 20211Mar 18, 20211
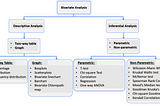
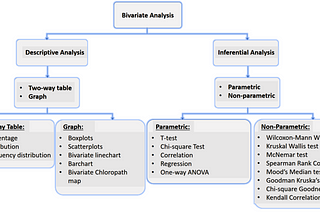
Ayobami AkiodeinAnalytics VidhyaVisualization not enough to assess relationship between 2 variables; Combine with Statistical testVisualization is never enough to conclude that a relationship exists between two Variables. It is best to confirm it Statistically.Feb 10, 2021Feb 10, 2021
Ayobami AkiodeinThe Startup4 Things to Do to Succeed as a Data Manager (Not Scientist) Consultant in an Unfamiliar DomainStarting out in an unfamiliar domain/field should be easyJan 10, 2021Jan 10, 2021
Ayobami AkiodeinDataDrivenInvestorJane! Your machine learning prediction has ruined meData Quality over everything. Else you lose everything !Jul 10, 2020Jul 10, 2020
Ayobami AkiodeinAnalytics VidhyaHow to carry out k-fold cross-validation on an imbalanced classification problemAn imbalance classification has its OWN rules. Know them, else you violate their rights.Jul 10, 20202Jul 10, 20202
Ayobami AkiodeinAnalytics VidhyaBasic example of a machine learning model prediction: Predicting modern contraceptive use in rural…In this article, we will use the real world example data of the demographic and health survey for Nigeria to develop a machine learning…Jun 25, 2020Jun 25, 2020